
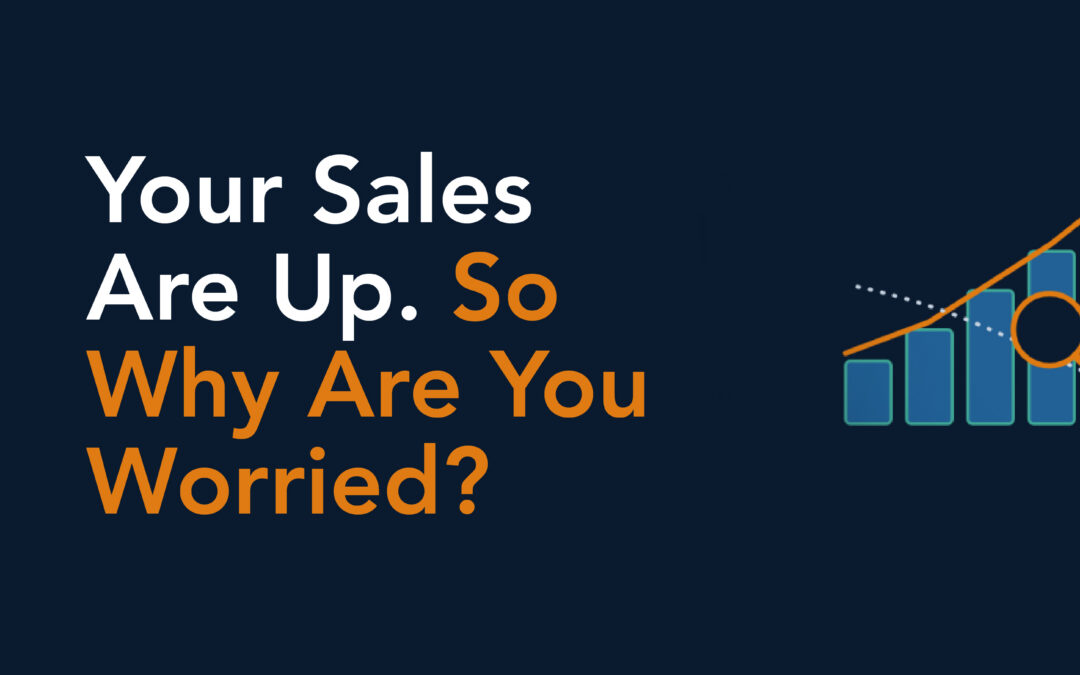
Your Sales Are Up. So Why Are You Worried?
Published: 6th Nov 26
Your Sales Are Up. So Why Are You Worried?
Why a rising sales line doesn’t always mean a healthier business, and which numbers tell you what’s actually happening
A client came to us with a simple problem: sales were up year on year, revenue looked healthy, and yet something about the numbers didn’t sit right. It took one layer below the headline figure to see why.
Revenue up 12%. Transactions down 4%. The growth was all in average spend, not demand.
This isn’t unusual. For growing multi-site and multi-entity businesses, a rising sales line is often the number that gets the least scrutiny, precisely because it looks like good news.
The risk isn’t that the number is wrong. It’s that it answers a different question than the one that actually matters.
Here’s what to look at alongside the headline sales number before taking it at face value.
1. Like-for-like sales can hide a falling customer base
Total revenue growth often comes from price increases, not more customers walking through the door or more invoices going out.
Like-for-like sales, stripped of price and site changes, is the number that shows whether the underlying business is actually growing.
Without it, a 10% price rise can look identical to a 10% increase in demand – and they call for very different decisions.
2. Mix shift inflates the top line without reflecting demand
A move toward higher-ticket products or services can lift revenue even while the number of transactions falls.
That’s not necessarily bad news, but it’s a different story than ‘the business is growing’, and it needs to be told as one.
Tracking revenue by product or service line, not just in total, is what surfaces this.
3. New sites flatter the group number
Adding a site or entity grows total revenue almost by definition, regardless of how existing sites are performing.
A group number that blends new and mature sites can mask two or three locations quietly declining underneath it.
Site-by-site reporting, not just group totals, is what keeps that visible.
4. Margin tells a different story than revenue
Revenue can rise while margin falls, particularly when cost inflation or discounting sits upstream of the number anyone sees first.
A sales report without a margin trend next to it only tells half the story.
The businesses that catch margin erosion early are the ones that look at it every month, not just at year-end.
5. The KPIs that actually explain a sales number
Volume, average transaction value, repeat rate and site-level detail are what turn a single sales figure into something you can act on.
None of these need to be complicated to track. They need to be tracked consistently, and read alongside the revenue line, not instead of it.
Investors and lenders already look at these alongside the headline number. It’s worth getting ahead of that.
None of this means the sales number is misleading on purpose. It usually just isn’t the whole picture.
A rising sales line. A falling transaction count underneath it. Two very different businesses, one headline number.
Because the businesses that get ahead of this read the sales number alongside what’s driving it – not months later, when the gap has already become a problem.
Subscribe
Get offers and stay up-to-date
